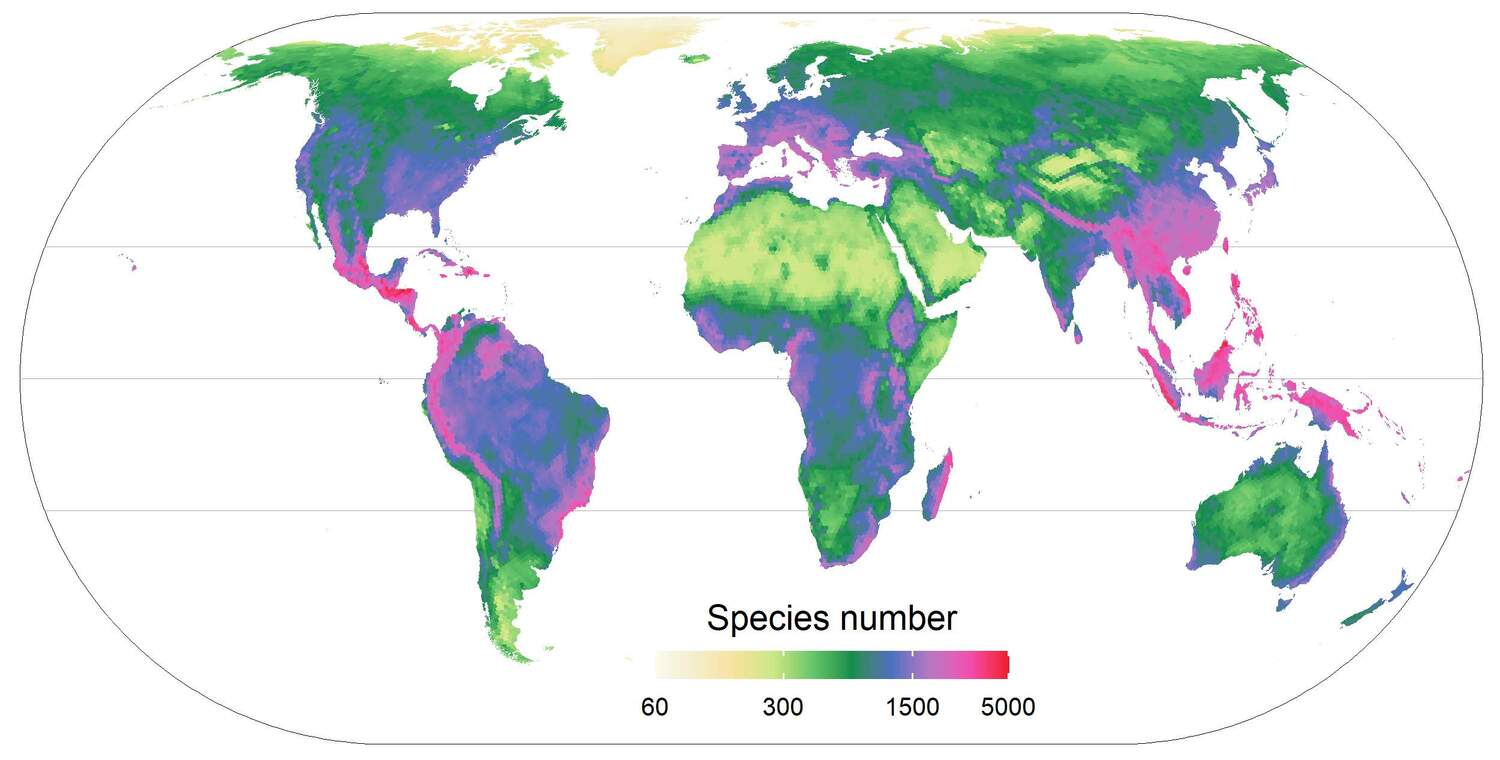
Global distribution of plant species richness across the globe as predicted using the distribution 300,000 plant species across 830 regional floras worldwide.
Photo: New Phytologist

Moist tropical mountain forests like here on La Réunion are characterized by a rich epiphyte flora
Photo: P Weigelt

Parque Nacional Sajama, Sajama (Bolivia). Very few plant species occur at the highest altitudes – such as these Polylepis trees on the Bolivian altiplano.
Photo: P Weigelt

Taiga forests dominated by a few tree species and grasslands span vast areas of the northern hemisphere. Here: Northern Mongolia.
Photo: P Weigelt
Why are there more plant species in some places than in others? Why is diversity highest in the tropics? What is the connection between biodiversity and environmental conditions? To help answer these questions, an international team led by researchers at the University of Göttingen has reconstructed the distribution of plant diversity around the world and made high-resolution predictions of where and how many plant species there are. This will support conservation efforts, help to protect plant diversity and assess changes in the light of the ongoing biodiversity and climate crises. Their research was published in New Phytologist.
Based on a unique global dataset of 830 regional floras and the distribution of 300,000 plant species compiled at the University of Göttingen over ten years, researchers modelled the relationship between plant diversity and environmental conditions using modern machine learning techniques. By incorporating the relatedness of the species to each other, they were able to take into account the evolutionary history of plants occurring in each geographic region. The models were then used to predict plant diversity continuously around the world considering past and present geographic and climatic conditions.
The global predictions show in unprecedented detail and accuracy how plant diversity is distributed across our planet.
Professor Holger Kreft, co-author
Biodiversity, Macroecology and Biogeography
University of Göttingen, Göttingen, GermanyThe models capture how diversity varies along environmental gradients and help to identify global centers of plant diversity. Current climate and further environmental factors emerged as primary drivers of plant diversity. The highest concentrations of plant diversity are predicted in environmentally heterogeneous tropical areas like Central America, the Andes and Amazonia, South-East Brazil, parts of Tropical Africa, Madagascar, southern China, Indochina and the Malay Archipelago as well as some Mediterranean regions like the Cape of Africa and locations around the Mediterranean Sea. Modern machine learning techniques and newly compiled plant distribution data were used to design the models. The resulting global maps of plant diversity provide a solid foundation for large-scale biodiversity monitoring and research on the origin of plant diversity and support future global biodiversity assessments and environmental policies.Knowing where to expect a certain number of species under present conditions allows researchers to assess future changes due to climate and land-use change as well as to identify impacts of overexploitation and introduced invasive species.
Dr Patrick Weigelt, co-lead author
Biodiversity, Macroecology and Biogeography
University of Göttingen, Göttingen, Germany

Fig. 2
Global patterns of vascular plant diversity predicted across an equal-area hexagon grid of 7774 km2 resolution. Species richness (a) and phylogenetic richness (Faith's PD, d) are based on ensemble predictions of five different models (i.e. three spatial models using machine learning methods, a spatial generalized additive model, and a nonspatial generalized linear model with interactions) weighted by model accuracy; species richness (b) and phylogenetic richness (e) centers are defined as regions with predicted richness values higher than the 90th quantile of the predictions (i.e. containing at least 1765 plant species and 41 866 Ma of phylogenetic richness per 7774 km2). Variation of predictions across models used for the ensemble predictions is calculated as coefficient of variation of predicted values for species richness (c) and phylogenetic richness (f). Horizontal lines depict the equator and borders of the tropics. In (a) and (d), log10 scale is used and all maps use Eckert IV projection. For maps of all different models and resolutions and data download, see https://gift.uni-goettingen.de/shiny/predictions/.
Global patterns of vascular plant diversity predicted across an equal-area hexagon grid of 7774 km2 resolution. Species richness (a) and phylogenetic richness (Faith's PD, d) are based on ensemble predictions of five different models (i.e. three spatial models using machine learning methods, a spatial generalized additive model, and a nonspatial generalized linear model with interactions) weighted by model accuracy; species richness (b) and phylogenetic richness (e) centers are defined as regions with predicted richness values higher than the 90th quantile of the predictions (i.e. containing at least 1765 plant species and 41 866 Ma of phylogenetic richness per 7774 km2). Variation of predictions across models used for the ensemble predictions is calculated as coefficient of variation of predicted values for species richness (c) and phylogenetic richness (f). Horizontal lines depict the equator and borders of the tropics. In (a) and (d), log10 scale is used and all maps use Eckert IV projection. For maps of all different models and resolutions and data download, see https://gift.uni-goettingen.de/shiny/predictions/.
The Team have published their work in the open access journal, New Phytologist. The the summary they say:
Summary
- Despite the paramount role of plant diversity for ecosystem functioning, biogeochemical cycles, and human welfare, knowledge of its global distribution is still incomplete, hampering basic research and biodiversity conservation.
- Here, we used machine learning (random forests, extreme gradient boosting, and neural networks) and conventional statistical methods (generalized linear models and generalized additive models) to test environment-related hypotheses of broad-scale vascular plant diversity gradients and to model and predict species richness and phylogenetic richness worldwide. To this end, we used 830 regional plant inventories including c. 300 000 species and predictors of past and present environmental conditions.
- Machine learning showed a superior performance, explaining up to 80.9% of species richness and 83.3% of phylogenetic richness, illustrating the great potential of such techniques for disentangling complex and interacting associations between the environment and plant diversity. Current climate and environmental heterogeneity emerged as the primary drivers, while past environmental conditions left only small but detectable imprints on plant diversity.
- Finally, we combined predictions from multiple modeling techniques (ensemble predictions) to reveal global patterns and centers of plant diversity at multiple resolutions down to 7774 km2. Our predictive maps provide accurate estimates of global plant diversity available at grain sizes relevant for conservation and macroecology.
Cai, L., Kreft, H., Taylor, A., Denelle, P., Schrader, J., Essl, F., van Kleunen, M., Pergl, J., Pyšek, P., Stein, A., Winter, M., Barcelona, J.F., Fuentes, N., Inderjit, , Karger, D.N., Kartesz, J., Kuprijanov, A., Nishino, M., Nickrent, D., Nowak, A., Patzelt, A., Pelser, P.B., Singh, P., Wieringa, J.J. and Weigelt, P. (2022),
Global models and predictions of plant diversity based on advanced machine learning techniques. New Phytol. https://doi.org/10.1111/nph.18533
Copyright: © 2022 The authors.
Published by John Wiley & Sons, Inc. Open access
Reprinted under a Creative Commons Attribution 4.0 International license (CC BY 4.0)

No comments :
Post a Comment
Obscene, threatening or obnoxious messages, preaching, abuse and spam will be removed, as will anything by known Internet trolls and stalkers, by known sock-puppet accounts and anything not connected with the post,
A claim made without evidence can be dismissed without evidence. Remember: your opinion is not an established fact unless corroborated.